Bitcoin‘s Unstoppable Rise: Is the Bull Run Just Getting Started?
Bitcoin, after hitting a new all-time high, continues to capture the attention of investors and analysts worldwide. While the recent price surge might lead some to believe the market is overheated, on-chain data paints a different picture. Several indicators suggest that the current rally may have more room to grow, with analysts pinpointing key levels for both potential resistance and support.
On-Chain Signals: No Peak in Sight Yet
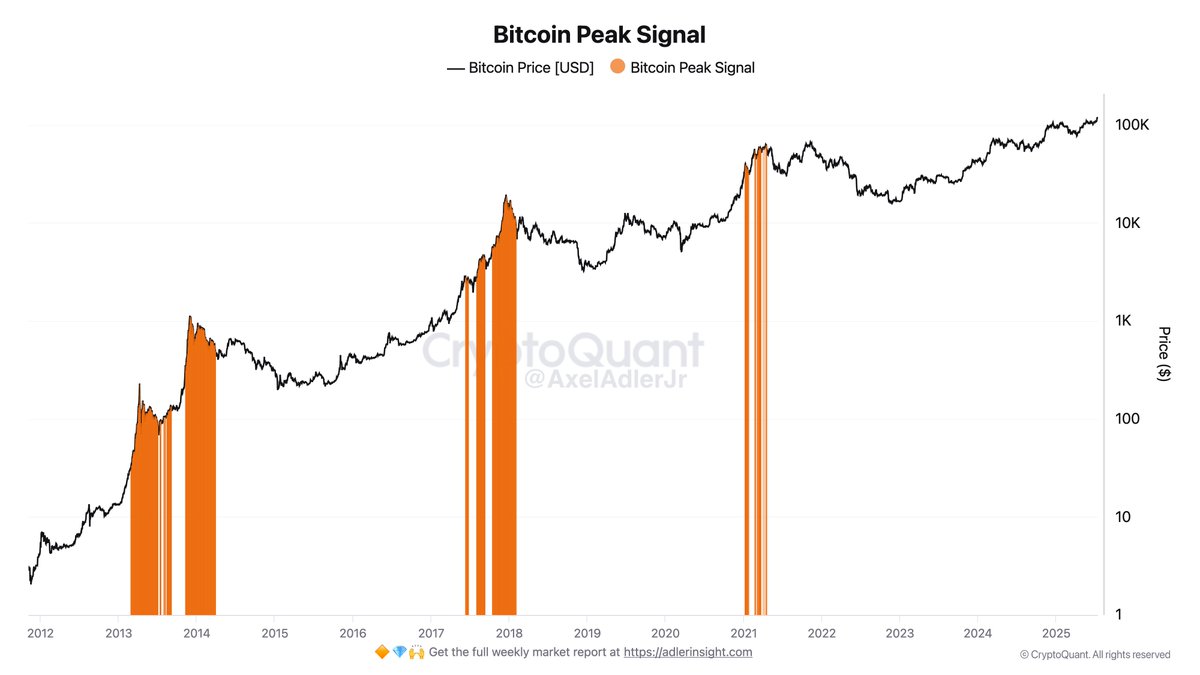
CryptoQuant analyst Axel Adler Jr. points out that the ‘Peak Signal,’ a metric designed to identify market tops, is currently absent. This signal typically appears at major market peaks, indicating an overheated market and a likely correction. Its absence suggests that the current bull run is not yet at its climax, hinting at further potential upside for Bitcoin.
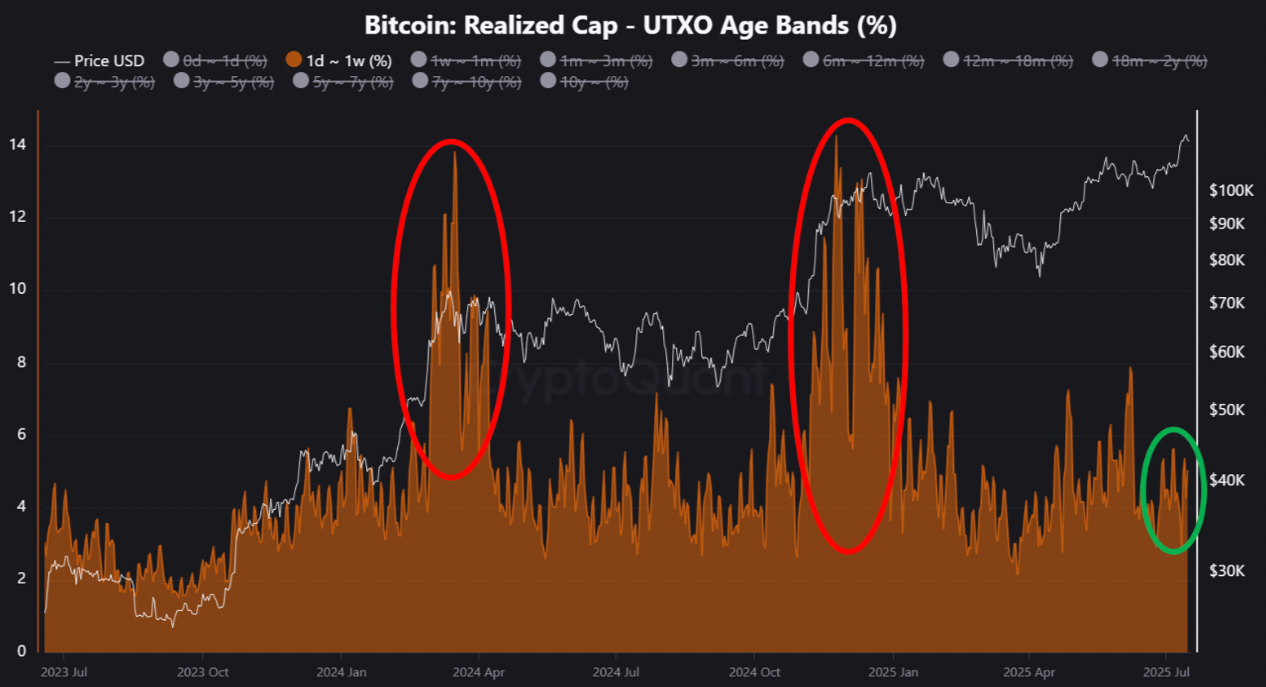
Similarly, the Bitcoin Realized Cap-UTXO Age Bands metric reinforces this perspective. This data shows the distribution of realized cap across different age cohorts. Despite Bitcoin‘s recent price highs, the percentage of the realized cap held by younger UTXOs (those aged 1 day to 1 week) remains relatively low compared to previous peak periods. This indicates that the market is not in an overheated state, suggesting that Bitcoin could continue to break all-time highs.
Resistance and Support Levels: Navigating the Volatility
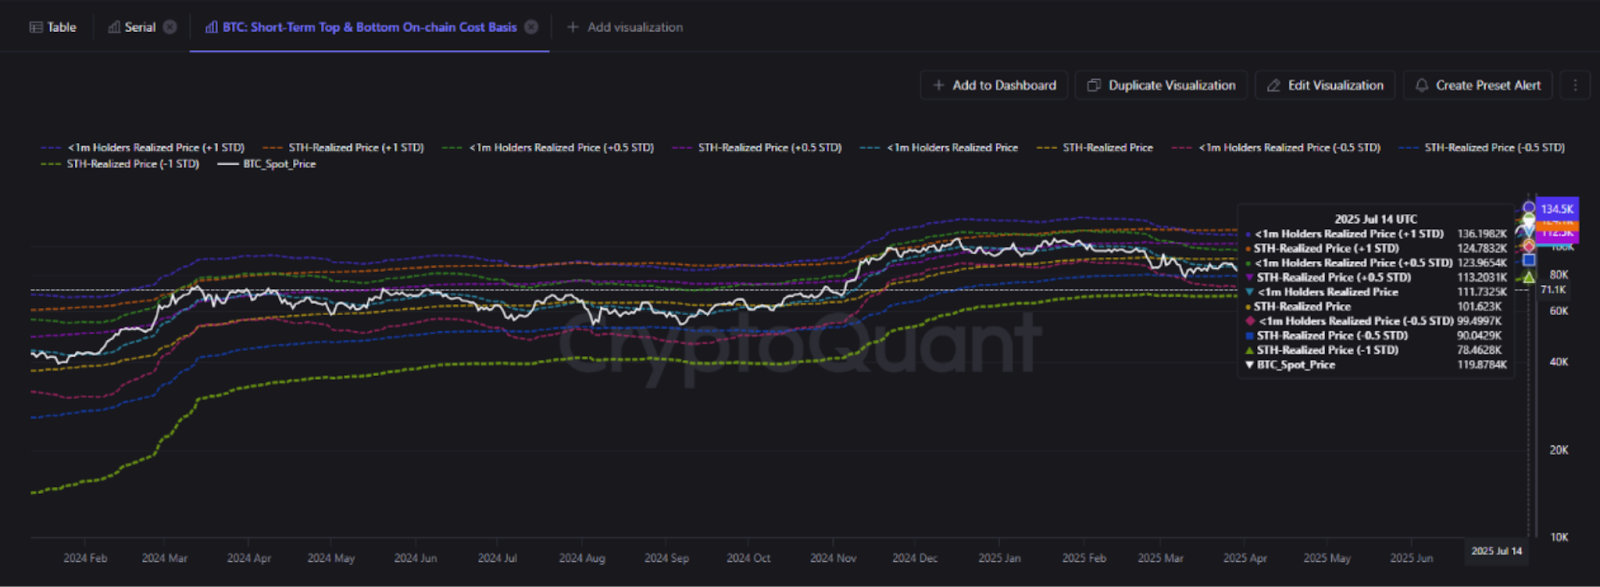
Analyzing the short-term holder (STH) cost basis, CryptoQuant‘s Crazzyblockk has identified crucial price levels that traders should monitor. These levels are derived from Bitcoin’s realized price model, providing insights into areas of active buying and potential price movement.
- Resistance Levels: The first major resistance level sits around $124,000, coinciding with the average cost basis of STHs plus one standard deviation. Historically, this range has often triggered profit-taking. The upper resistance, at $136,000, reflects the average cost basis of investors who have held BTC for less than 30 days, plus one standard deviation.
- Support Levels: On the downside, key support levels include $113,000, $111,000, and $101,000. The $101,000 level is described as the most critical support for Bitcoin‘s medium-term bullish structure.
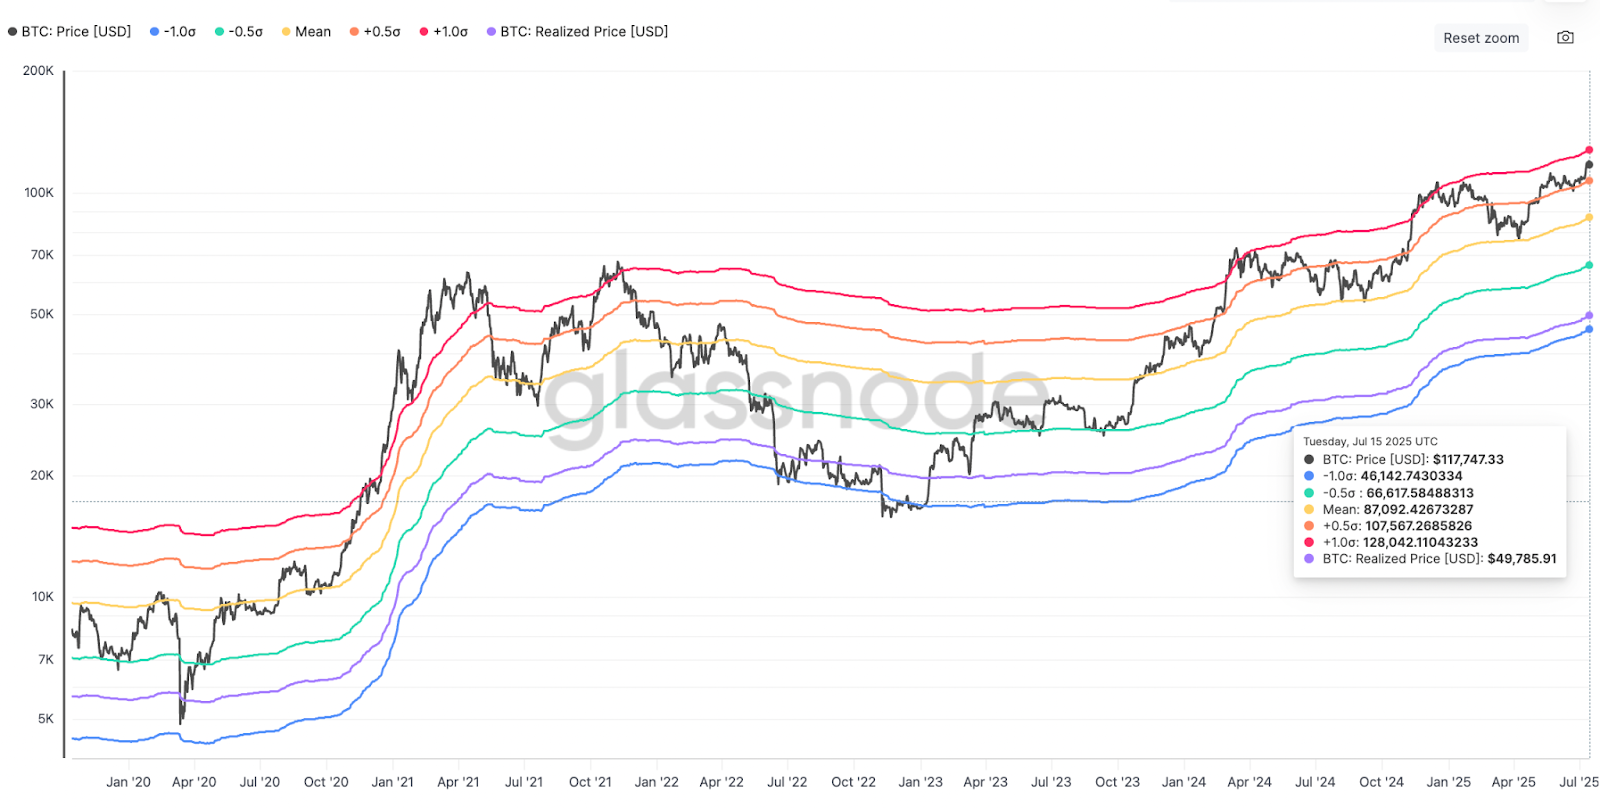
The Market Value to Realized Value (MVRV) Z-Score further supports the bullish outlook, as it remains well below historical peak levels, suggesting room for price expansion. A key area of interest on the downside resides between $113,700 and $115,300, aligned with the 200-day EMA.
Conclusion: Staying Ahead of the Curve
While Bitcoin‘s recent performance is undeniably impressive, on-chain analysis suggests that the current bull run is far from over. Monitoring the resistance and support levels outlined by analysts and keeping a close eye on key indicators will be crucial for navigating the market’s volatility and identifying potential opportunities. As always, it is recommended to conduct thorough research and consider your own risk tolerance before making any investment decisions.