Bitcoin‘s Price Wobbles: A Test of $69,000
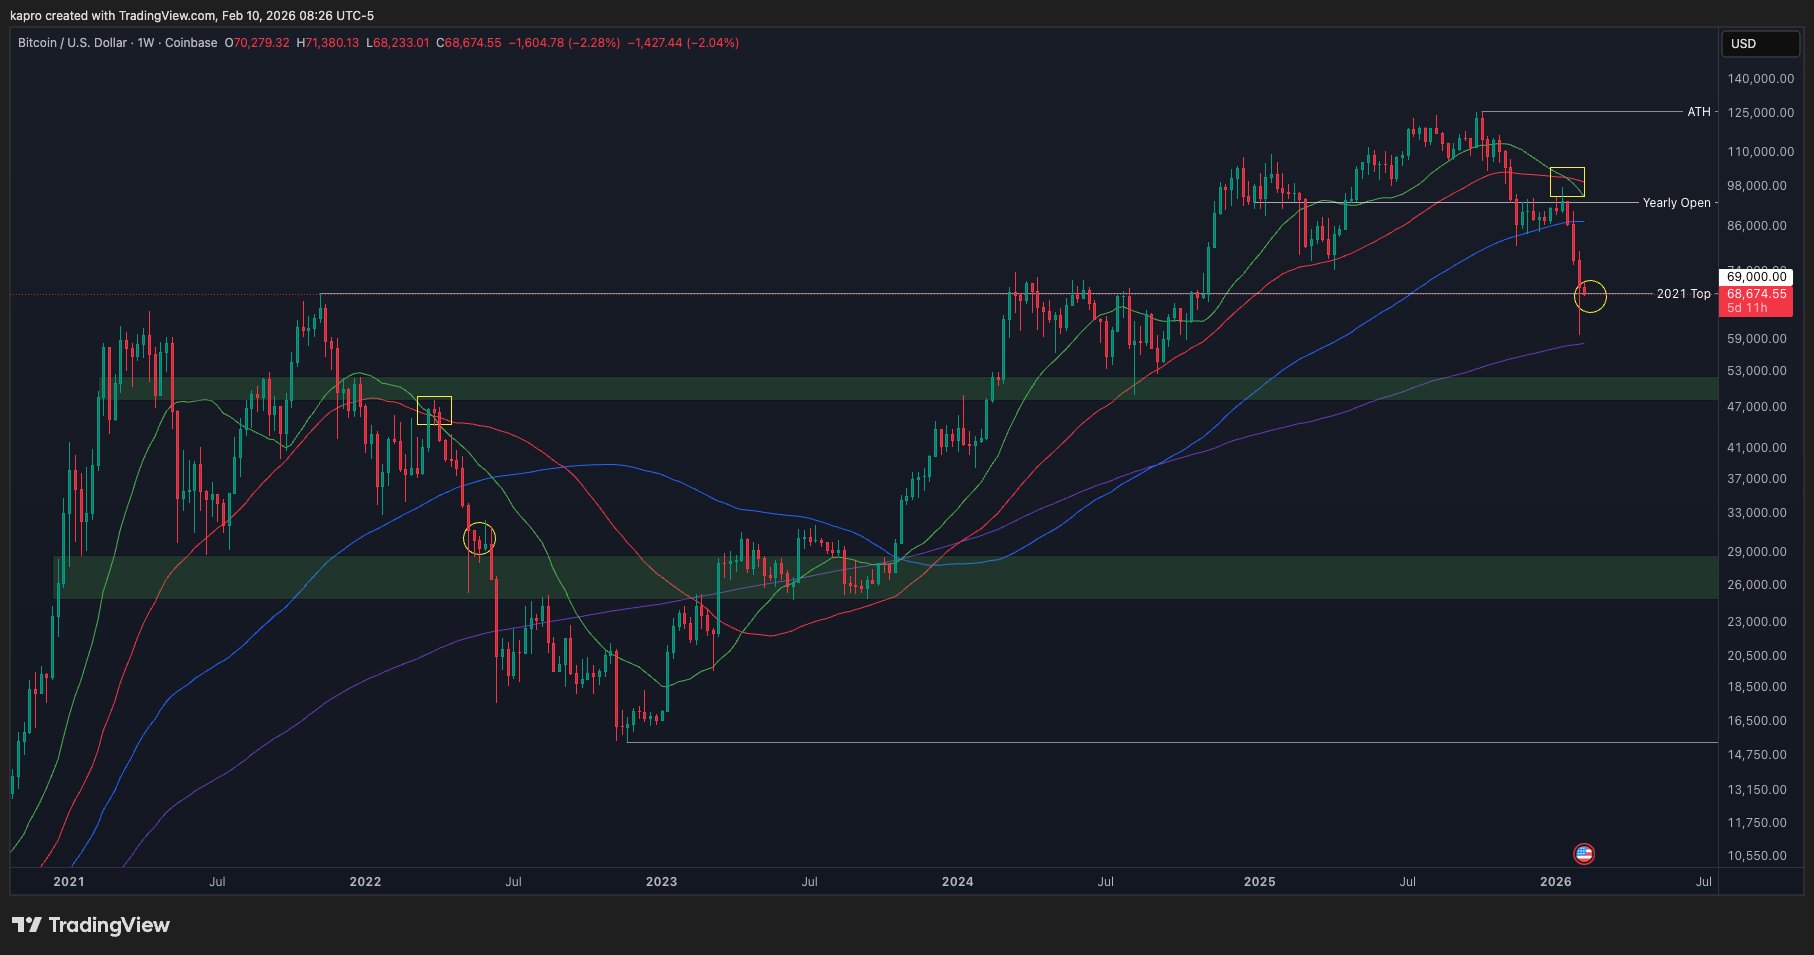
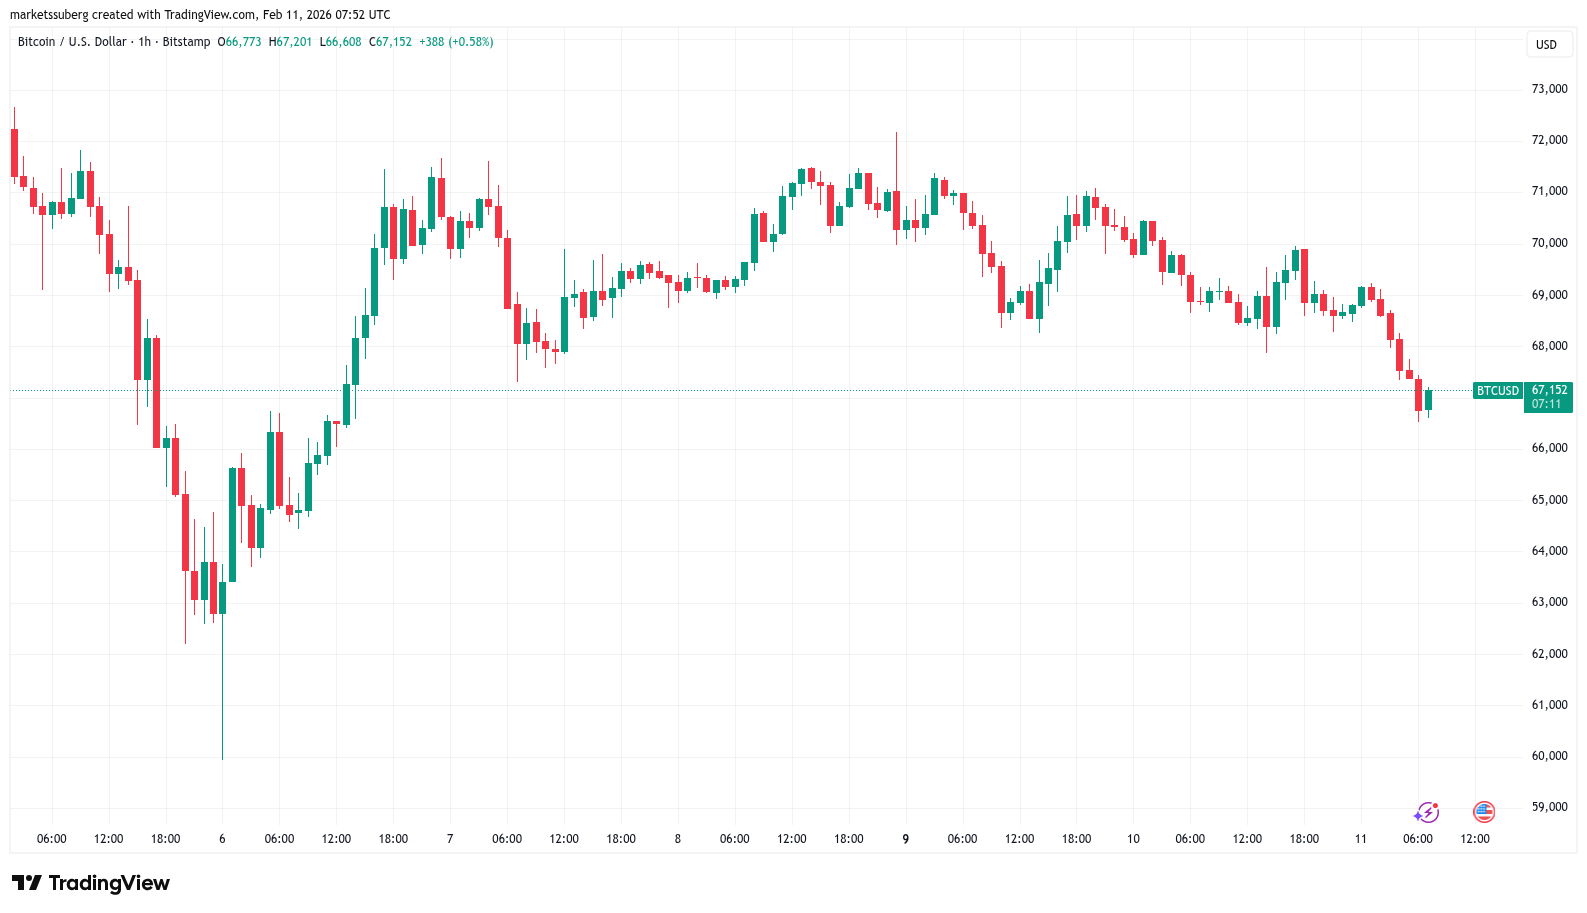
Bitcoin experienced a notable price correction, dipping nearly 3% and putting the spotlight squarely on the $69,000 mark. This crucial level, previously a source of bullish anticipation, is now being scrutinized as a potential resistance point, leaving traders and analysts to reassess the short-term outlook for the leading cryptocurrency. The recent pullback underscores the ongoing volatility within the crypto market, reminding investors of the inherent risks associated with digital assets.

Analyzing the Resistance: Historical Context Matters
The significance of $69,000 transcends mere numerical value; it carries considerable weight due to its historical implications within Bitcoin‘s price trajectory. According to market analysts, including those from Material Indicators, this specific price range saw extensive consolidation in 2024, building a structural strength that is now influencing market behavior. This historical context suggests that breaking through this resistance will demand significant bullish momentum, which, according to current analysis, is currently lacking.
Lack of Momentum: The Bearish Perspective
The inability of Bitcoin to decisively breach $69,000 has prompted bearish sentiments among some analysts. The absence of sufficient buying pressure has cast a shadow over the market‘s immediate prospects, raising concerns about extended consolidation phases or even a continuation of the downtrend. The possibility of prolonged stagnation at these levels, or worse, a retreat towards lower support zones, is actively being discussed. The current market dynamics highlight the delicate balance between supply and demand, and the crucial role that buyer enthusiasm plays in price movements.
February’s Performance: A Look at Historical Data
February’s performance is also contributing to the uncertainty. Data indicates that Bitcoin‘s losses this month are almost mirroring those of the previous year. While historical analysis points out that February has only closed in the red on a few occasions, the current figures are prompting a deeper look into seasonal trends. The market is also acknowledging the common trend of Bitcoin‘s monthly high or low often being printed around the fourth to seventh day of each month.