Bitcoin‘s Teeter-Totter: A Bullish Signal or a Bearish Mirage?
Bitcoin experienced a notable rally, briefly touching $76,900 after dipping to a 15-month low of $72,860. While this might appear as a sign of renewed bullish momentum, a deeper dive into market indicators paints a more cautious picture. Several technical and on-chain metrics suggest that the recent price surge could be short-lived, potentially leading to a deeper correction in the coming weeks or months.

Technical Indicators Flashing Red
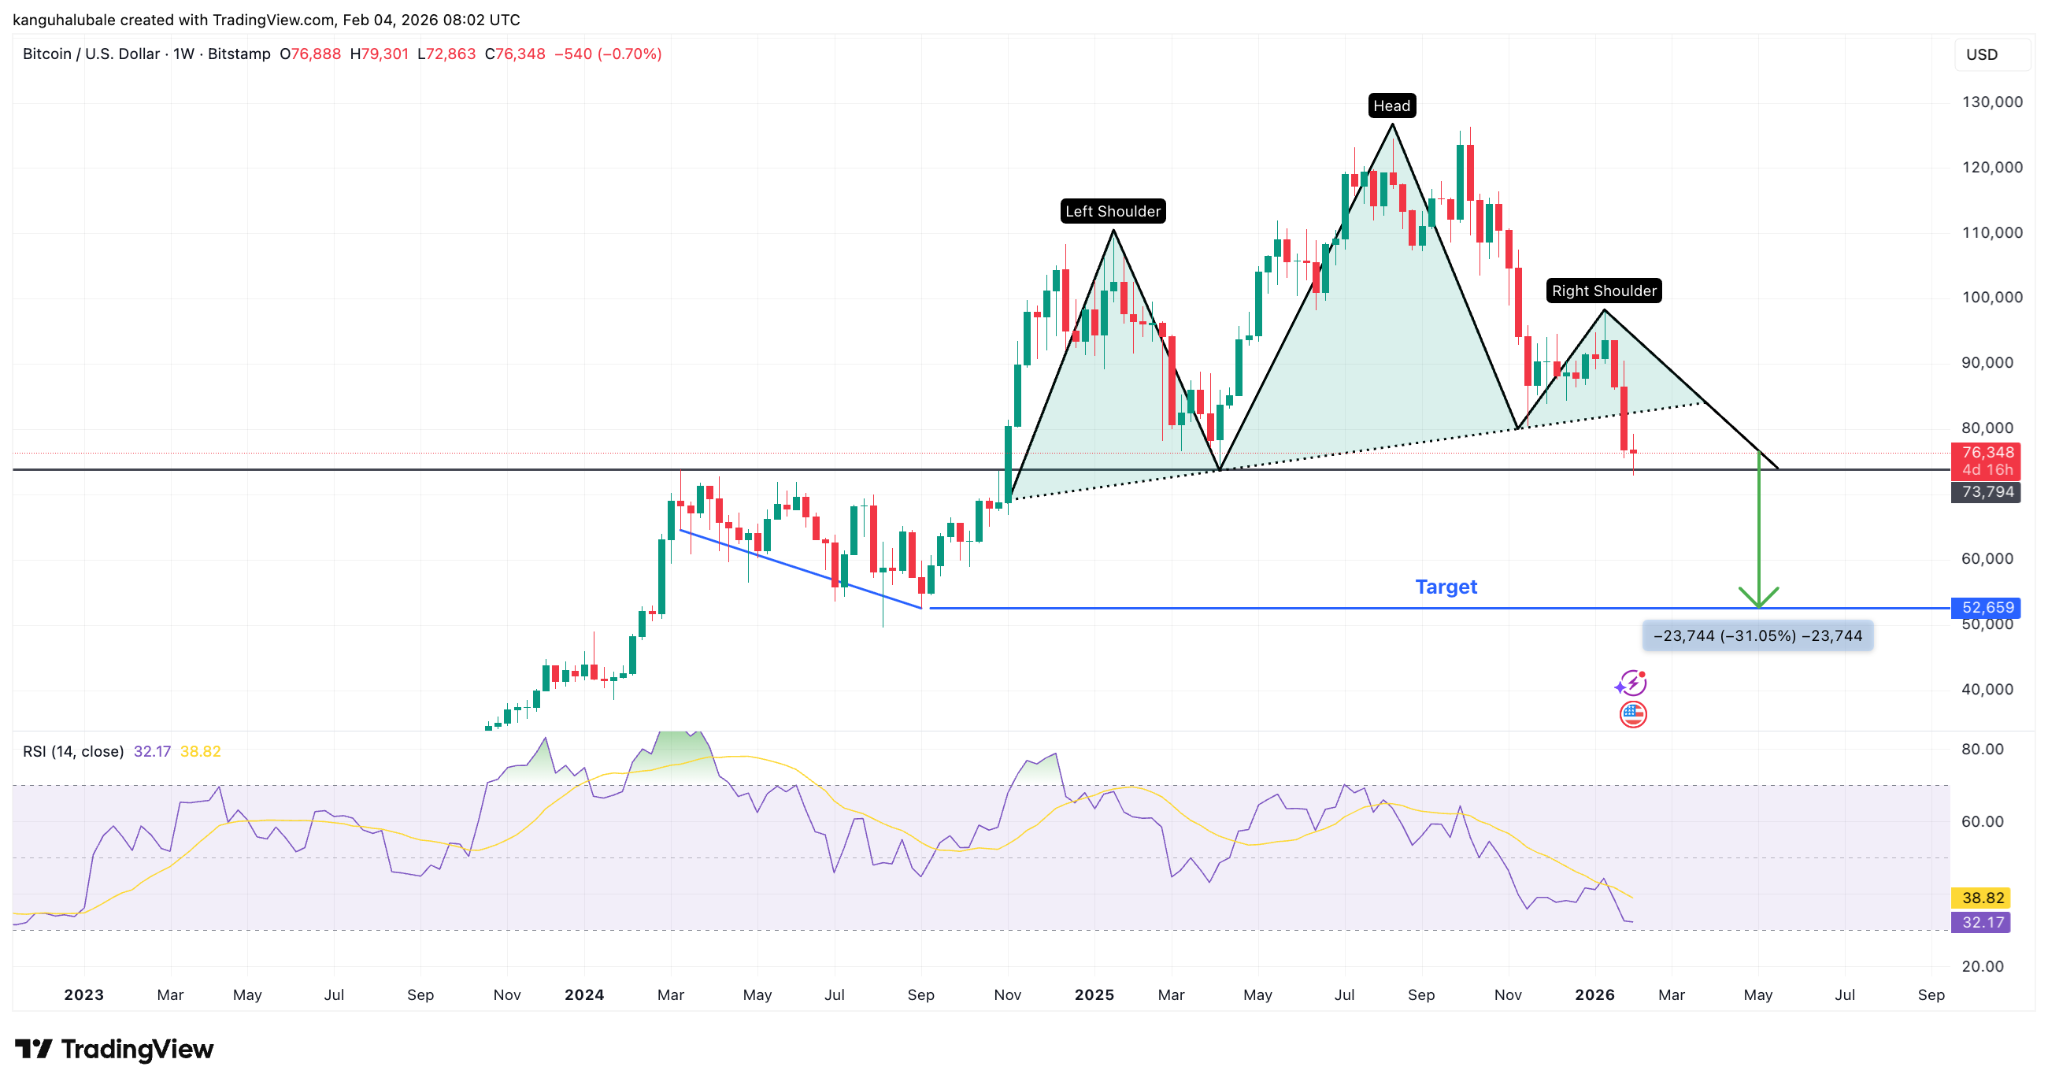
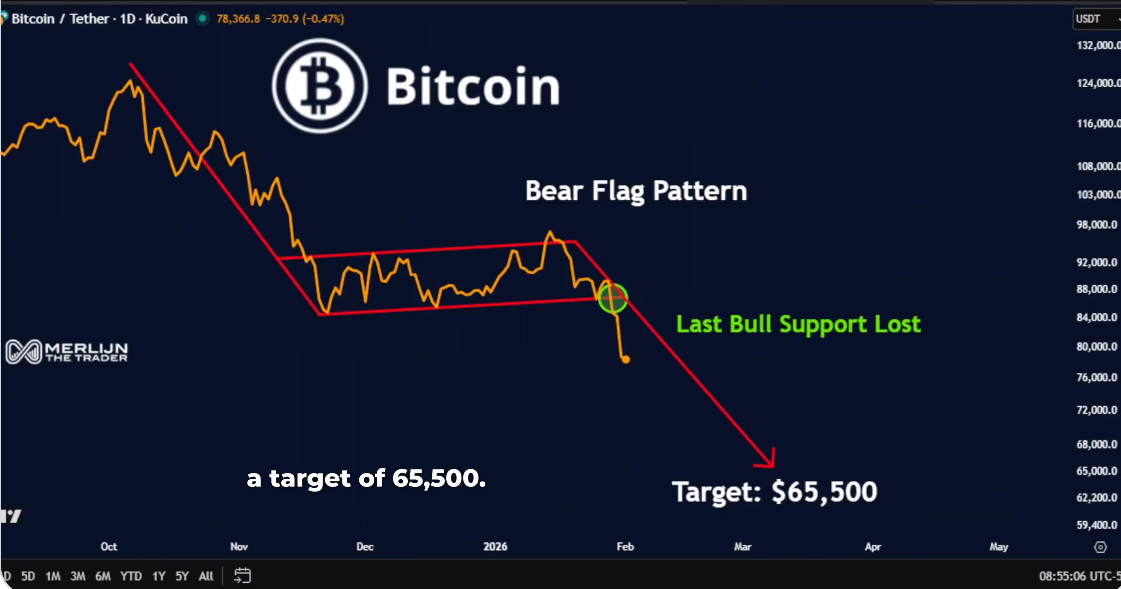
The technical landscape surrounding Bitcoin currently presents a mixed bag. Analysts point to confirmed bearish patterns on various timeframes. The formation of a head-and-shoulders (H&S) pattern on the weekly chart is particularly concerning. This pattern, with a neckline around $82,000, suggests a potential price target of around $52,650, representing a significant drop from current levels. Furthermore, the daily chart shows the confirmation of a bear flag pattern, hinting at further downward pressure.
The Puell Multiple and Miner Capitulation
The Puell Multiple, an indicator that assesses miners’ daily revenue against their annual average, is currently residing in the ‘discount zone.’ This indicates that miners are under pressure due to lower revenues, potentially leading to miner capitulation. Historically, extended periods in this zone have preceded further price declines. Decreasing miner reserves, a declining network hash rate, and increased inflows of BTC to exchanges like Binance, could intensify this effect.
On-Chain Data: A Closer Look at Binance Inflows
A recent surge in Bitcoin inflows to Binance has sparked debate. On-chain data revealed a significant influx of Bitcoin onto the exchange, the highest since November 2025. This often signals a surge in selling pressure as holders attempt to de-risk, anticipating further price declines. While some analysts suggest this could be a sign of capitulation and a potential bottom, it simultaneously indicates that a significant amount of selling pressure is being absorbed by the market.
The current market landscape presents a complex picture. The price recovery above $74,000 may be short-lived. Traders should carefully monitor key support levels and price action. The interplay between technical patterns, on-chain data, and the behavior of miners will be crucial in determining Bitcoin’s next move. It’s essential for investors to conduct their due diligence and manage risk prudently during these uncertain times, as market conditions can change rapidly.