

XRP‘s Price Dance: Awaiting a Defining Move
Ripple‘s XRP has been navigating a period of price consolidation, leaving traders and investors alike pondering its next move. While the cryptocurrency ecosystem eagerly anticipates potential developments, the current price action presents a picture of cautious optimism. The crucial resistance level of $2.35 looms large, and its breach could be a pivotal moment for XRP‘s trajectory.
ETF Hopes and Market Expectations
The anticipation surrounding a potential XRP exchange-traded fund (ETF) approval is a significant factor shaping market sentiment. Industry experts, including Bloomberg’s ETF specialists Eric Balchunas and James Seyffart, have pegged a high probability (95%) for XRP, Solana (SOL), and Litecoin (LTC) ETFs being greenlit by the US Securities and Exchange Commission (SEC) in 2025. This positive outlook has fueled speculation and has investors watching for signs of a breakout. But will the consolidation serve as a springboard, or will the bears prevail?
Technical Analysis: Key Levels to Watch
The technical indicators present a nuanced perspective. On the daily chart, XRP recently pushed above the 50-day simple moving average ($2.24), but the long wick on the candlestick indicates resistance at higher levels.
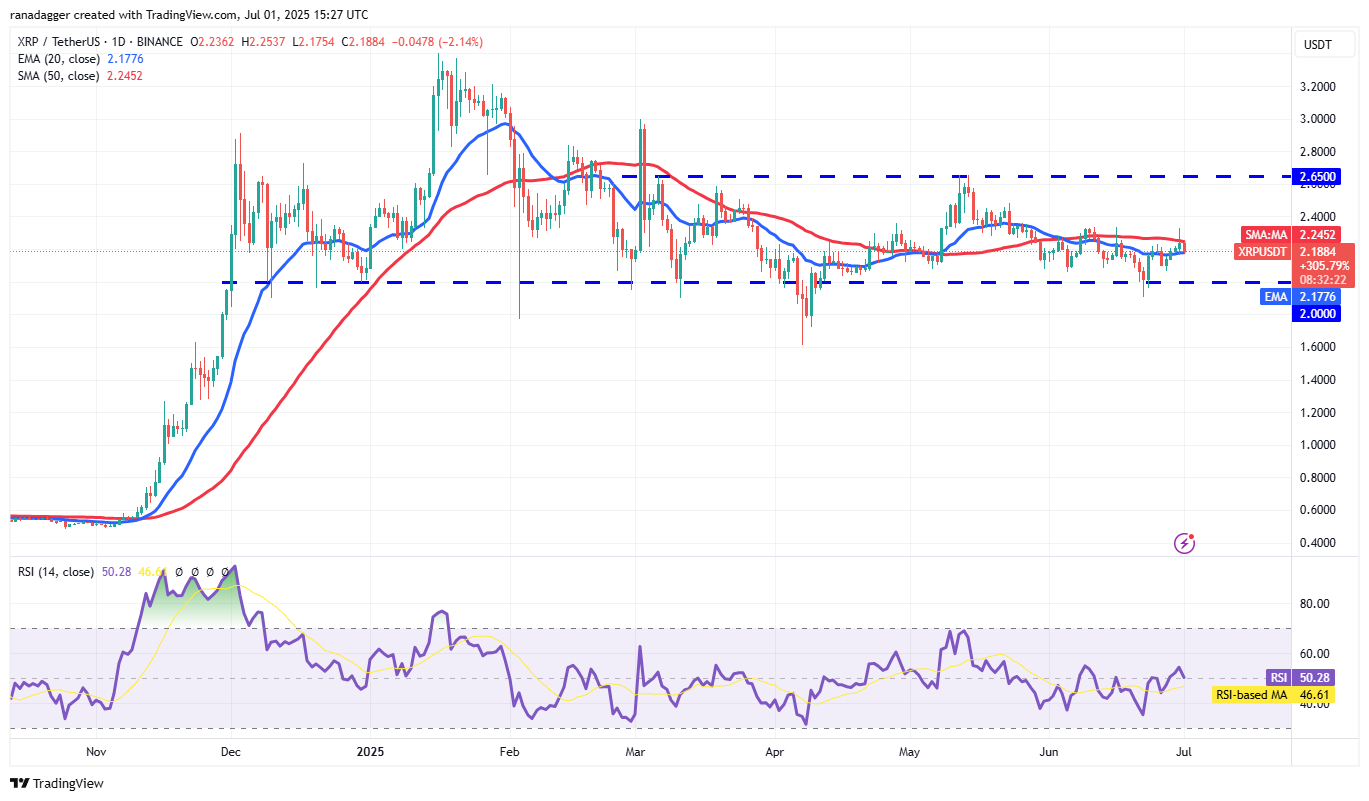
The 20-day exponential moving average ($2.17) is a critical support level; a strong rebound from this point could signal a break above $2.35, potentially driving the price towards $2.65. Conversely, a break below the 20-day EMA could empower the bears, potentially leading to a drop toward $2.06 and further declines.
Support and Resistance Dynamics
The $2 level is a crucial support zone. If it fails to hold, a more substantial correction to $1.61 could follow. The 4-hour chart reveals the bears vigorously defending the $2.35 resistance.
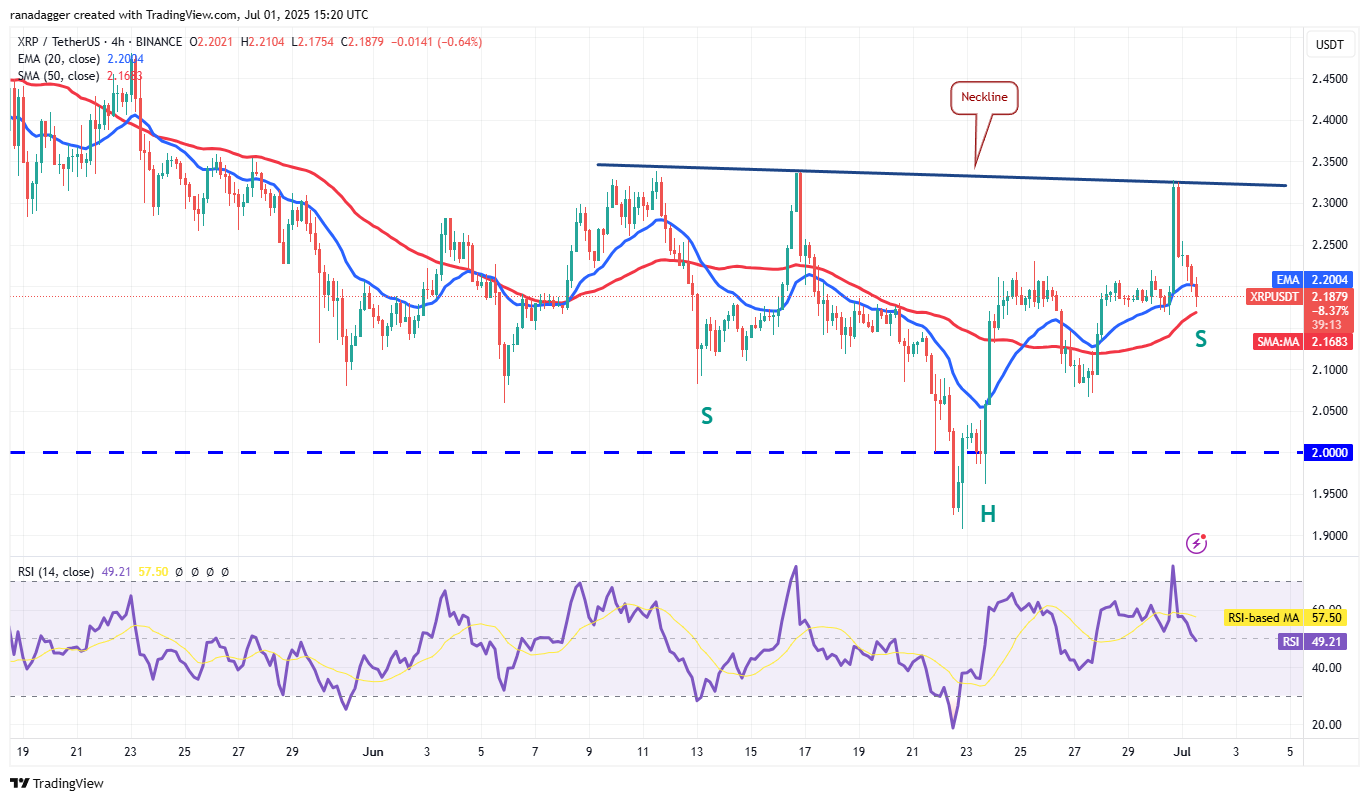
If the bears maintain dominance, the price could fall to $2.06. A break above the neckline of an inverse head-and-shoulders pattern, if validated, could target $2.76. Investors should closely monitor these levels to understand market direction.
Looking Ahead: The Path Forward
The future of XRP hinges on a confluence of factors: the overall market sentiment, regulatory developments, and, most importantly, the ability to decisively break through key resistance levels. The potential for an ETF approval adds a layer of complexity and excitement to the narrative. Traders should carefully consider both the bullish and bearish scenarios, utilizing technical indicators and risk management strategies.
This article is for informational purposes only and does not constitute financial advice. Always conduct your own research before making any investment decisions.